
이전 글에서 consul 을 구축하였다.
[2/5] Node-exporter → Consul → Promethus → Grafana 연동하기
이전 글에서 node-exporter 를 구축하였다.이제 consul 을 구축해보자② Consul파이프라인을 구성할 때 consul 이 반드시 필요하지는 않다. 결국 prometheus 에서만 exporter 를 알면 되기 때문이다. 하지만 consu
elsboo.tistory.com
이제 prometheus 를 구축해보자
③ Prometheus
prometheus 는 exporter 들을 한데로 모으는 깔때기 같은 역할이다. node-exporter 를 consul 을 통해 prometheus 에 등록할 수 있게 해보겠다.
docker-compose.yml
version: '3'

services:
  prometheus:
    image: prom/prometheus:v2.54.1
    container_name: prometheus
    ports:
      - "9090:9090"
    networks:
      - monitoring
    volumes:
      - ./config:/etc/prometheus
      - ./data:/data
    command:
      - '--config.file=/etc/prometheus/prometheus.yml'
      - '--storage.tsdb.path=/data'
      - '--web.enable-lifecycle'
      - '--storage.tsdb.retention.time=10d'
      - '--log.level=debug'

networks:
  monitoring:
    name: monitoring
driver: bridge--config.file: prometheus.yml 설정파일 경로--storage.tsdb.path=/data: 데이터 저장 경로--storage.tsdb.retention.time: 데이터 유지 기간--web.enable-lifecycle:/reload나/quitAPI 를 호출해prometheus를 리로드하거나 종료할 수 있다.networks:consul나node-exporter컨테이너에서 이 컨테이너를 접근할 수 있도록 “monitoring” 이라는 이름의 네트워크로 묶어주었다.
prometheus.yml 도 필요하다. 어떤 job 을 어떤 방식으로 수집할것인지에 대한 설정이다 (독스)
global:
  scrape_interval: 5s
scrape_configs:
  - job_name: "prometheus"
    scrape_interval: 3s
    scrape_timeout: 1s
    static_configs:
      - targets: ["localhost:9090"]
  - job_name: "node_exporter"
    follow_redirects: true
    scrape_interval: 5s
    scrape_timeout: 1s
    consul_sd_configs:
      - server: "consul:8500"
        services: ["node-exporter"]
    relabel_configs:
      - source_labels: ["__address__"]
        regex: "(.*):(.*)"
        replacement: "${1}"
        target_label: "host"
      - source_labels: ["__address__"]
        regex: "(.*):(.*)"
        replacement: "${2}"
        target_label: "ip"
      - source_labels: ["__meta_consul_service"]
        regex: "(.*)"
        replacement: "$1"
        target_label: "job"
global.scrape_interval: 5s: 5초 마다 수집한다. 글로벌 설정이므로 job 별로 설정된scrape_interval가 있으면 그 값을 따른다.scrape_configs: job 별로 속성값을 정의한다.
- job_name: "prometheus"
prometheus 자기 자신에 대한 데이터 수집이다.
static_configs
어디에서 데이터를 수집할 것인가에 대한 설정이다. prometheus 가 http://localhost:9090 에 떠있으므로 targets 에 설정해주었다.
- job_name: "node_exporter"
consul_sd_configs
consul 을 통해서 데이터를 수집한다. consul 서버는 http://consul:8500 이다. prometheus 와 consul 이 도커 컨테이너이기 때문에 host 에 컨테이너명인 consul 을 넣어주었다.
consul 에 등록된 exporter 중에 이름이 node-exporter 인 애들만 수집할 것이기 때문에 services 는 node-exporter 로 설정하였다.
relabel_configs
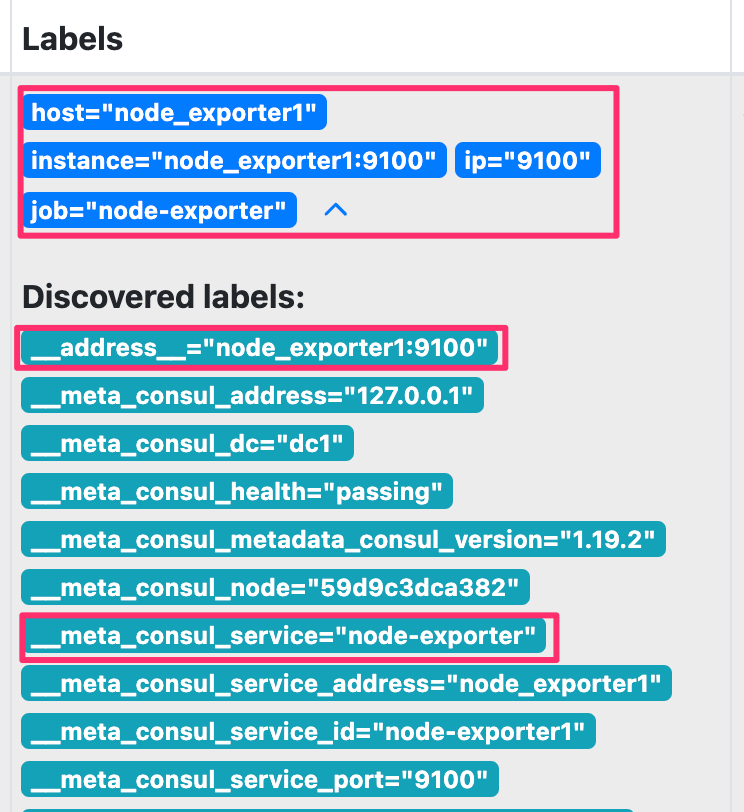
prometheus 에 등록된 exporter 마다 붙어있는 라벨이 있다. 이 라벨들의 값을 파싱해 새로운 라벨을 만드는걸 relabel_configs 에서 할 수 있다.
host 라벨 만들기
- source_labels: ["__address__"]
  regex: "(.*):(.*)"
  replacement: "${1}"
  target_label: "host"
__address__ 라벨 값은 node_exporter1:9100 이다. 정규식으로 파싱하여 첫 번째 그룹값인 node_exporter1 에 host 라벨을 단다.
ip 라벨 만들기
- source_labels: ["__address__"]
  regex: "(.*):(.*)"
  replacement: "${2}"
  target_label: "ip"
정규식으로 파싱하여 두 번째 그룹값인 9100 에 ip 라벨을 단다.
job 라벨 만들기
- source_labels: ["__meta_consul_service"]
  regex: "(.*)"
  replacement: "$1"
  target_label: "job"
__meta_consul_service 라벨 값은 node-exporter 이다. 정규식으로 파싱한 전체 값을 job 라벨에 단다.
최종 라벨 결과는 이렇게 된다.
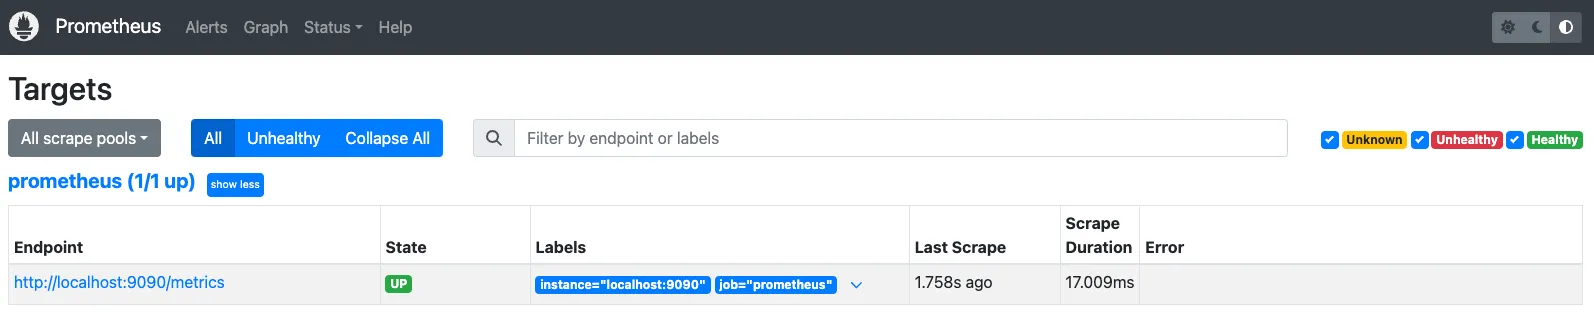
그리고 docker-compose.yml 가 있는 폴더에서 docker-compose up -d 를 해주고 http://localhost:9090 에 접속하면 prometheus 화면이 뜬다.
prometheus 까지 띄웠으니 다음 글에서 consul 에 node-exporter 를 등록해보자
[4/5] Node-exporter → Consul → Promethus → Grafana 연동하기
이전 글에서 prometheus 을 구축하였다. [2/5] Node-exporter → Consul → Promethus → Grafana 연동하기이전 글에서 node-exporter 를 구축하였다.이제 consul 을 구축해보자② Consul파이프라인을 구성할 때 consul 이
elsboo.tistory.com
'SearchDeveloper > 모니터링' 카테고리의 다른 글
| [5/5] Node-exporter → Consul → Promethus → Grafana 연동하기 (0) | 2024.10.13 |
|---|---|
| [4/5] Node-exporter → Consul → Promethus → Grafana 연동하기 (1) | 2024.10.13 |
| [2/5] Node-exporter → Consul → Promethus → Grafana 연동하기 (1) | 2024.10.10 |
| [1/5] Node-exporter → Consul → Promethus → Grafana 연동하기 (1) | 2024.10.10 |


