
이전 글에서 node-exporter 를 구축하였다.
[1/5] Node-exporter → Consul → Promethus → Grafana 연동하기
최종 결과: 시스템 정보를 그라파나 대시보드로 확인할 수 있다각종 데이터를 그라파나를 통해 대시보드로 편리하게 확인할 수 있다. cpu 사용량, 메모리 사용량 같은 시스템 정보를 그라파나로
elsboo.tistory.com
이제 consul 을 구축해보자
② Consul
파이프라인을 구성할 때 consul 이 반드시 필요하지는 않다. 결국 prometheus 에서만 exporter 를 알면 되기 때문이다. 하지만 consul 이 가지고 있는 큰 장점이 있다. 바로 서비스 디스커버리이다.
서비스 디스커버리는 node-exporter 같은 서비스를 API 한 번 호출 같이 좀 더 편한 방법으로 감지할 수 있다.

(*.json 은 나중에 쓰인다. 지금은 필요없다.)
docker-compose.yml
version: '3'

services:
  consul:
    image: hashicorp/consul:1.19
    container_name: consul
    ports:
      - "8500:8500"
    networks:
      - monitoring
    volumes:
      - ./data:/data

networks:
  monitoring:
    name: monitoring
    driver: bridge
networks : prometheus 나 node-exporter 컨테이너에서 이 컨테이너를 접근할 수 있도록 “monitoring” 이라는 이름의 네트워크로 묶어주었다.
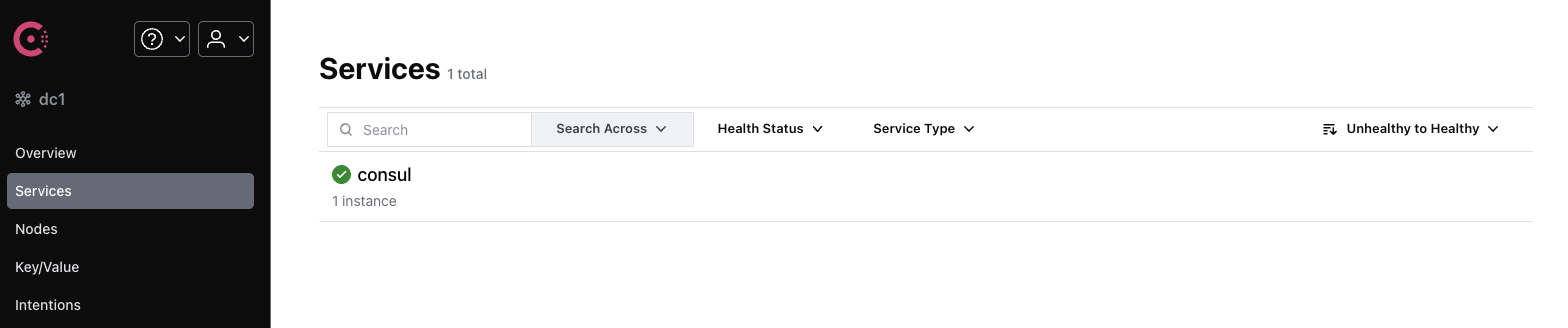
그리고 docker-compose.yml 가 있는 폴더에서 docker-compose up -d 를 해주고 http://localhost:8500 에 접속하면 consul 화면이 뜬다.
consul 에 node-exporter 를 등록하는 작업은 prometheus 를 띄운 후 해볼 것이다.
다음 글에서는 prometheus 구축을 해보자.
[3/5] Node-exporter → Consul → Promethus → Grafana 연동하기
이전 글에서 consul 을 구축하였다. [2/5] Node-exporter → Consul → Promethus → Grafana 연동하기이전 글에서 node-exporter 를 구축하였다.이제 consul 을 구축해보자② Consul파이프라인을 구성할 때 consul 이 반
elsboo.tistory.com
'SearchDeveloper > 모니터링' 카테고리의 다른 글
| [5/5] Node-exporter → Consul → Promethus → Grafana 연동하기 (0) | 2024.10.13 |
|---|---|
| [4/5] Node-exporter → Consul → Promethus → Grafana 연동하기 (1) | 2024.10.13 |
| [3/5] Node-exporter → Consul → Promethus → Grafana 연동하기 (0) | 2024.10.13 |
| [1/5] Node-exporter → Consul → Promethus → Grafana 연동하기 (1) | 2024.10.10 |


